Average monthly snow and rainfall in Chilanga
The mean monthly precipitation over the year in Chilanga (), including rain, snow, hail.
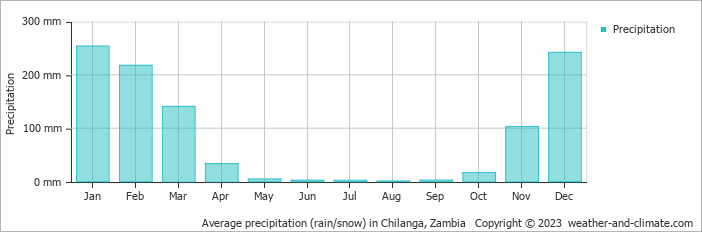
- A lot of rain (rainy season) falls in the months: January, February, March, November and December.
- Chilanga has dry periods in May, June, July, August, September and October.
- On average, January is the wettest month with 254 mm of precipitation.
- On average, August is the driest month with 1 mm of precipitation.
- The average amount of annual precipitation is 1018 mm.
Weather Forecasts for Chilanga
Wed Apr 24
30°C | 16°C
E  14 km/h
14 km/hclear and no rain
Thu Apr 25
29°C | 17°C
E 18 km/h
18 km/hclear and no rain
Fri Apr 26
29°C | 17°C
E 22 km/h
22 km/halmost clear and no rain


