Average monthly snow and rainfall in Cerro Punta
The mean monthly precipitation over the year in Cerro Punta (Chiriqui), including rain, snow, hail.
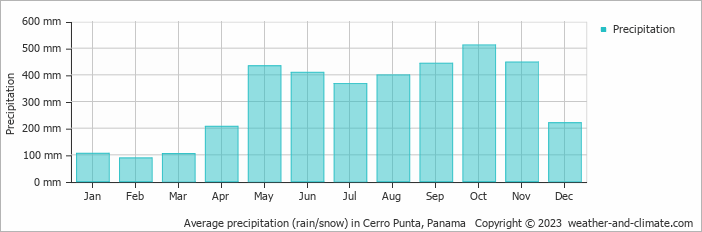
- A lot of rain (rainy season) falls in the months: January, March, April, May, June, July, August, September, October, November and December.
- On average, October is the wettest month with 512 mm of precipitation.
- On average, February is the driest month with 88 mm of precipitation.
- The average amount of annual precipitation is 3733 mm.
Weather Forecasts for Cerro Punta
Wed Apr 24
15°C | 9°C
NE  11 km/h
11 km/h3.8 mm
overcast and thunder
Thu Apr 25
15°C | 9°C
N 11 km/h
11 km/h4.2 mm
overcast and heavy rain
Fri Apr 26
16°C | 9°C
N 11 km/h
11 km/h8.8 mm
broken clouds and thunder