ClimateForecastAprilMay >>

Average monthly snow and rainfall in Cabrera

The mean monthly precipitation over the year in Cabrera (), including rain, snow, hail.

Average monthly rainfall, snow, precipitation in Cabrera,

Feel free to add this climate graph to your website. Click the copy button above.

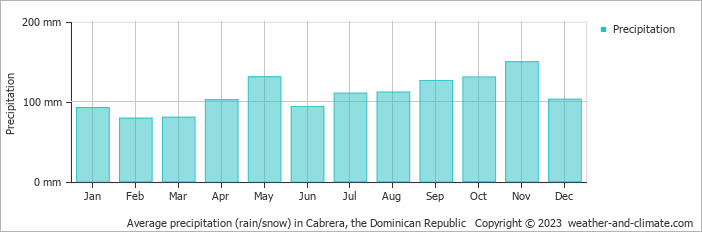
  • A lot of rain (rainy season) falls in the months: April, May, July, August, September, October, November and December.
  • On average, November is the wettest month with 149 mm of precipitation.
  • On average, February is the driest month with 79 mm of precipitation.
  • The average amount of annual precipitation is 1308 mm.

Weather Forecasts for Cabrera

Fri   Apr 19
28°C | 20°C
NE 18 km/h
2.9 mm
partly cloudy and small chance of rain

partly cloudy and small chance of rain

Sat   Apr 20
28°C | 20°C
NE 18 km/h
1.5 mm
partly cloudy and  chance of rain

partly cloudy and chance of rain

Sun   Apr 21
28°C | 20°C
E 22 km/h
1.1 mm
partly cloudy and  chance of slight rain

partly cloudy and chance of slight rain

Interested in more climate information?

Weather and Climate provides you with all the information you need about the climate in Cabrera.

Our site offers climate and forecast data for every country in the world. Are you going to the Dominican Republic? On this website you can find historical weather averages for many cities in the Dominican Republic. Not sure yet where to go? We now have a tool which recommends destinations that suit your ideal climate conditions. Find out where to go with our weather planner.