Average monthly snow and rainfall in Burgerbrug
The mean monthly precipitation over the year in Burgerbrug (Noord-Holland), including rain, snow, hail.
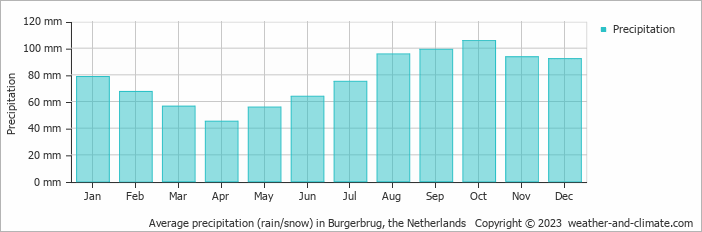
- Most rainfall (rainy season) is seen in October.
- On average, October is the wettest month with 106 mm of precipitation.
- On average, April is the driest month with 45 mm of precipitation.
- The average amount of annual precipitation is 928 mm.
Weather Forecasts for Burgerbrug
Wed Apr 24
9°C | 4°C
N  32 km/h
32 km/h1.7 mm
broken clouds and chance of rain
Thu Apr 25
10°C | 3°C
SW 25 km/h
25 km/h6.9 mm
overcast and heavy rain
Fri Apr 26
11°C | 3°C
W 7 km/h
7 km/h1.2 mm
partly cloudy and chance of slight rain


