Average monthly snow and rainfall in Broek in Waterland
The mean monthly precipitation over the year in Broek in Waterland (Noord-Holland), including rain, snow, hail.
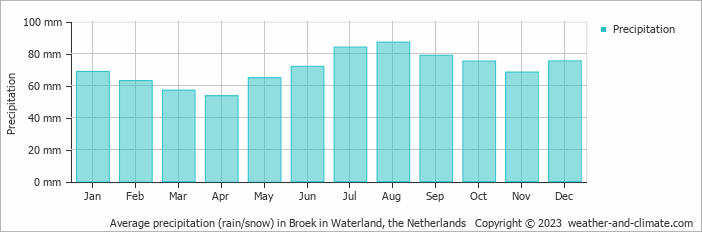
- On average, August is the wettest month with 87 mm of precipitation.
- On average, April is the driest month with 54 mm of precipitation.
- The average amount of annual precipitation is 847 mm.
Weather Forecasts for Broek in Waterland
Thu Apr 25
10°C | 3°C
SW  29 km/h
29 km/h5.8 mm
overcast and rain
Fri Apr 26
11°C | 4°C
SW 11 km/h
11 km/h3.3 mm
broken clouds and chance of slight rain
Sat Apr 27
16°C | 7°C
S 18 km/h
18 km/h2.5 mm
overcast and rain


