ClimateForecastAprilMay >>

Average monthly snow and rainfall in Windhoek

The mean monthly precipitation over the year in Windhoek (), including rain, snow, hail.

Average monthly rainfall, snow, precipitation in Windhoek,

Feel free to add this climate graph to your website. Click the copy button above.

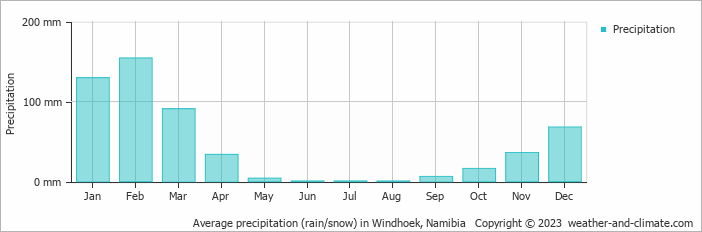
  • Most rainfall (rainy season) is seen in January and February.
  • Windhoek has dry periods in May, June, July, August, September and October.
  • On average, February is the wettest month with 154 mm of precipitation.
  • On average, August is the driest month with 1 mm of precipitation.
  • The average amount of annual precipitation is 540 mm.

Weather Forecasts for Windhoek

Tue   Apr 16
30°C | 15°C
W 22 km/h
clear and no rain

clear and no rain

Wed   Apr 17
31°C | 14°C
NW 22 km/h
clear and no rain

clear and no rain

Thu   Apr 18
32°C | 13°C
NE 11 km/h
clear and no rain

clear and no rain

Interested in more climate information?

Weather and Climate provides you with all the information you need about the climate in Windhoek.

Our site offers climate and forecast data for every country in the world. Are you going to Namibia? On this website you can find historical weather averages for many cities in Namibia. Not sure yet where to go? We now have a tool which recommends destinations that suit your ideal climate conditions. Find out where to go with our weather planner.