Average monthly snow and rainfall in Port Moresby (Papua Region) in inches

This is the mean monthly precipitation over the year, including rain, snow, hail etc.
Show average precipitation in Port Moresby in Millimeter »

Average precipitation (rain/snow) in Port Moresby, Papua New Guinea   Copyright © 2023  weather-and-climate.com

Feel free to add this climate graph to your website. Click the copy button above.


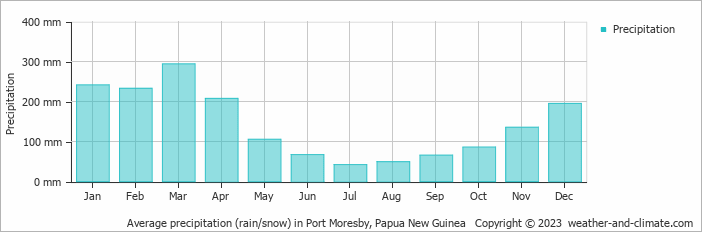
  • A lot of rain (rainy season) falls in the months: January, February, March, April, May, June, July, August, September, October, November and December.
  • On average, January is the wettest month with 13 inches (330 mm) of precipitation.
  • On average, June is the driest month with 4.1 inches (103 mm) of precipitation.
  • The average amount of annual precipitation is: 100.2 inches (2545 mm)


Weather Forecasts for Port Moresby (Papua Region)

Wed   Mar 22
93°F | 73°F
N 7 mph
0.18 inches
broken clouds and thunder

broken clouds and thunder

Thu   Mar 23
91°F | 73°F
SW 7 mph
0.36 inches
broken clouds and thunder

broken clouds and thunder

Fri   Mar 24
91°F | 73°F
SW 7 mph
0.31 inches
broken clouds and thunder

broken clouds and thunder

Where to stay in Port Moresby

Interested in more climate information?

Weather and Climate provides you with all the information you need about the climate in Port Moresby.

Our site offers climate and forecast data for almost all countries in the world. Are you going to Papua New Guinea? On this website you can find historical weather averages for many cities in Papua New Guinea. Not sure yet where to go? We now have a tool which suggests which destination suits your ideal climate conditions. Find out where to go with our weather planner.