ClimateForecastAprilMay >>

Average monthly snow and rainfall in Panjgur

The mean monthly precipitation over the year in Panjgur (), including rain, snow, hail.

Average monthly rainfall, snow, precipitation in Panjgur,

Feel free to add this climate graph to your website. Click the copy button above.

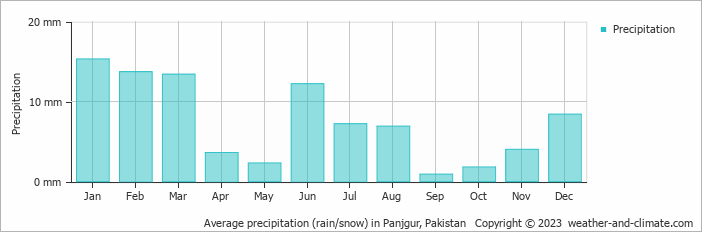
  • Panjgur has dry periods in January, February, March, April, May, June, July, August, September, October, November and December.
  • On average, January is the wettest month with 15 mm of precipitation.
  • On average, September is the driest month with 1 mm of precipitation.
  • The average amount of annual precipitation is 90 mm.

Weather Forecasts for Panjgur

Tue   Apr 16
25°C | 18°C
SW 14 km/h
5.3 mm
overcast and heavy rain

overcast and heavy rain

Wed   Apr 17
23°C | 17°C
S 47 km/h
12 mm
broken clouds and thunder

broken clouds and thunder

Thu   Apr 18
26°C | 18°C
SW 22 km/h
3.5 mm
partly cloudy and rain

partly cloudy and rain

Interested in more climate information?

Weather and Climate provides you with all the information you need about the climate in Panjgur.

Our site offers climate and forecast data for every country in the world. Are you going to Pakistan? On this website you can find historical weather averages for many cities in Pakistan. Not sure yet where to go? We now have a tool which recommends destinations that suit your ideal climate conditions. Find out where to go with our weather planner.