ClimateForecastAprilMay >>

Average monthly snow and rainfall in Kuujjuanq

The mean monthly precipitation over the year in Kuujjuanq (), including rain, snow, hail.

Average monthly rainfall, snow, precipitation in Kuujjuanq,

Feel free to add this climate graph to your website. Click the copy button above.

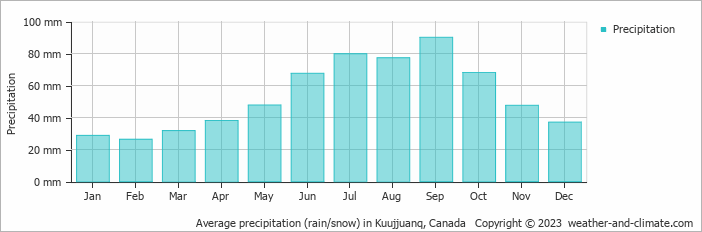
  • On average, September is the wettest month with 90 mm of precipitation.
  • On average, February is the driest month with 26 mm of precipitation.
  • The average amount of annual precipitation is 639 mm.

Weather Forecasts for Kuujjuanq

Fri   Apr 19
2°C | -7°C
NE 22 km/h
4.6 mm
overcast and small chance of rain

overcast and small chance of rain

Sat   Apr 20
2°C | -6°C
W 25 km/h
14 mm
overcast and sleet

overcast and sleet

Sun   Apr 21
1°C | -9°C
SW 18 km/h
2.2 mm
overcast and slight snow

overcast and slight snow

Interested in more climate information?

Weather and Climate provides you with all the information you need about the climate in Kuujjuanq.

Our site offers climate and forecast data for every country in the world. Are you going to Canada? On this website you can find historical weather averages for many cities in Canada. Not sure yet where to go? We now have a tool which recommends destinations that suit your ideal climate conditions. Find out where to go with our weather planner.