Average monthly snow and rainfall in Altdorf
The mean monthly precipitation over the year in Altdorf (Uri), including rain, snow, hail.
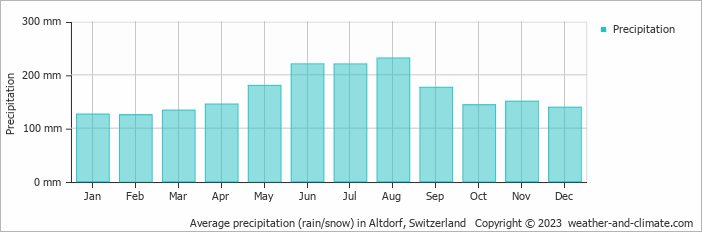
- A lot of rain (rainy season) falls in the months: January, February, March, April, May, June, July, August, September, October, November and December.
- On average, August is the wettest month with 231 mm of precipitation.
- On average, February is the driest month with 125 mm of precipitation.
- The average amount of annual precipitation is 1990 mm.
Weather Forecasts for Altdorf
Thu Apr 18
8°C | 1°C
NW  18 km/h
18 km/h6.3 mm
overcast and heavy rain
Fri Apr 19
4°C | -1°C
W 11 km/h
11 km/h21 mm
overcast and rain
Sat Apr 20
3°C | 1°C
NW 18 km/h
18 km/h20 mm
overcast and heavy rain