Miyako Island Monthly Rainfall & Precipitation
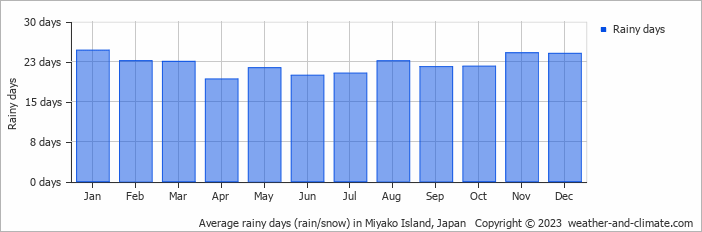
This page shows both the average monthly rainfall and the number of rainy days in Miyako Island, Okinawa islands, Japan. These values are calculated using 30 years of data (1990–2020) to ensure accuracy. Now, let's explore all the details to give you a full picture.
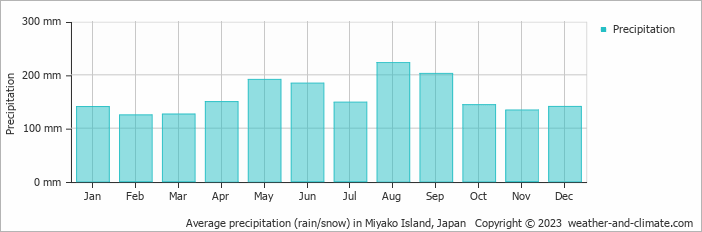
Miyako Island is known for its substantial rainfall, with annual precipitation reaching 1907 mm (75 in).
Monthly Precipitation Levels
The average number of days each month with precipitation (> 0.2 mm (0.01 in))
Miyako Island offers a pleasant mix of wetter and slightly drier months. The difference in precipitation between August (223 mm (8.8 in)) and February (125 mm (4.9 in)) is not too significant, making the climate enjoyable for visitors and residents alike.
August, the wettest month, has a maximum daytime temperature of 30°C (86°F). The city receives 211 hours of sunshine in this period. During the driest month February you can expect a temperature of 22°C (72°F). For more detailed insights into the city's temperatures, visit our Miyako Island Temperature page.
Daily Historical Precipitation
50-year average (1976-2025)
Average daily rainfall for each day of the month based on long-term records.
Average precipitation in June
Explore Miyako Island's Historical Precipitation: 1976-2026
Browse day-by-day precipitation records for Miyako Island spanning 51 years. Select any month and year to see actual rainfall and snowfall recorded on each day.
Annual Rainfall in Japan: City Comparison
The map below shows the annual precipitation across Japan. You can also select the different months in case you are interested in a specific month.
 heavy rainfall
 high
high
 moderate
 low
low
 almost none
Miyako Island vs World: Rainfall Compared
Miyako Island's average annual precipitation is 1907 mm (75 in). Let's compare this to some popular worldwide tourist destinations:
Boston, USA, experiences 1238 mm (49 in) of annual precipitation, including significant snowfall during the winter.
Osaka, Japan, experiences 1507 mm (59 in) of rainfall annually, spread across the year with wetter summers.
Melbourne, Australia, has 690 mm (27 in) of rainfall annually, spread fairly evenly throughout the year.
Kuala Lumpur, Malaysia, receives 2529 mm (100 in) of annual rainfall, characteristic of its equatorial tropical rainforest climate, with consistent rainfall throughout the year and peak months during March and November.
Precipitation amounts are measured using specific gauges installed at weather stations, collecting both rain and snow and any other type of precipitation. Rainfall is measured directly in millimeters, while that from snow and ice is obtained by melting it. Automated systems often incorporate heaters to make this easier.
Information from these stations is transmitted via Wi-Fi, satellite, GPS, or telephone connections to central monitoring networks. This information is immediately updated and integrated into weather models and forecasts.
- Mawsynram in India is noted as being the wettest place on earth, with over 11 meters (36 feet) of rain falling every year.
- In contrast, Antofagasta in Chile is among the driest places on the planet, getting less than 0.1mm (0.004 inches) per year, with some years recording virtually no rainfall.
- Nearly 1,650 thunderstorm cells are estimated over the planet at any given time.
For more detailed information about Miyako Island's weather, including sunshine hours, humidity levels, and temperature data, visit our Miyako Island Climate page.