ClimateForecastAprilMay >>

Average temperature in Table View

The mean minimum and maximum temperatures over the year in Table View (Western Cape), South Africa.

Average monthly minimum and maximum temperature in Table View,

Feel free to add this climate graph to your website. Click the copy button above.

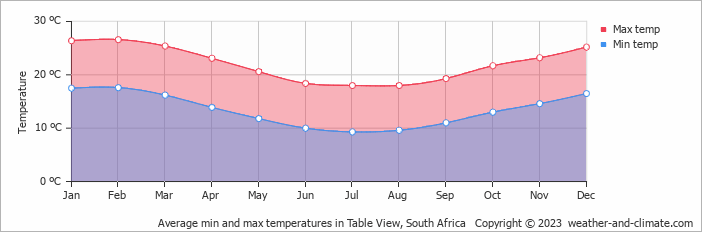
  • On average, the warmest month is February with 27°C.
  • On average, the coolest month is August with 18°C.
  • The average annual maximum temperature is 22°C.
  • The average annual minimum temperature is 13°C.

Weather Forecasts for Table View

Fri   Apr 19
27°C | 14°C
W 7 km/h
partly cloudy and no rain

partly cloudy and no rain

Sat   Apr 20
25°C | 14°C
SW 7 km/h
broken clouds and no rain

broken clouds and no rain

Sun   Apr 21
22°C | 13°C
W 14 km/h
partly cloudy and no rain

partly cloudy and no rain

Interested in more climate information?

Weather and Climate provides you with all the information you need about the climate in Table View.

Our site offers climate and forecast data for every country in the world. Are you going to South Africa? On this website you can find historical weather averages for many cities in South Africa. Not sure yet where to go? We now have a tool which recommends destinations that suit your ideal climate conditions. Find out where to go with our weather planner.

)