ClimateForecastAprilMay >>

Average temperature in Shirdi

The mean minimum and maximum temperatures over the year in Shirdi (Maharashtra), India.

Average monthly minimum and maximum temperature in Shirdi,

Feel free to add this climate graph to your website. Click the copy button above.

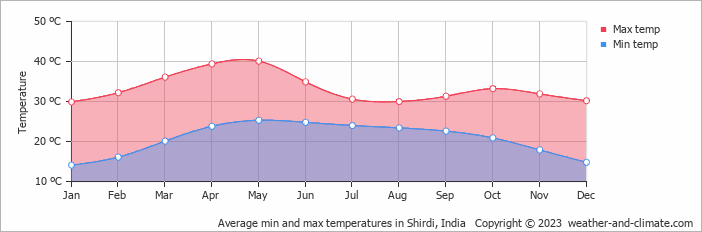
  • The months of January and August have nice average temperatures.
  • On average, the temperatures are always high.
  • On average, the warmest month is May with 40°C.
  • On average, the coolest month is January with 30°C.
  • The average annual maximum temperature is 33°C.
  • The average annual minimum temperature is 21°C.

Weather Forecasts for Shirdi

Fri   Apr 19
41°C | 27°C
N 14 km/h
partly cloudy and no rain

partly cloudy and no rain

Sat   Apr 20
41°C | 27°C
NW 14 km/h
almost clear and no rain

almost clear and no rain

Sun   Apr 21
40°C | 26°C
W 18 km/h
almost clear and no rain

almost clear and no rain

Interested in more climate information?

Weather and Climate provides you with all the information you need about the climate in Shirdi.

Our site offers climate and forecast data for every country in the world. Are you going to India? On this website you can find historical weather averages for many cities in India. Not sure yet where to go? We now have a tool which recommends destinations that suit your ideal climate conditions. Find out where to go with our weather planner.

)