Average temperature in San Vito lo Capo
The mean minimum and maximum temperatures over the year in San Vito lo Capo (Sicily), Italy.
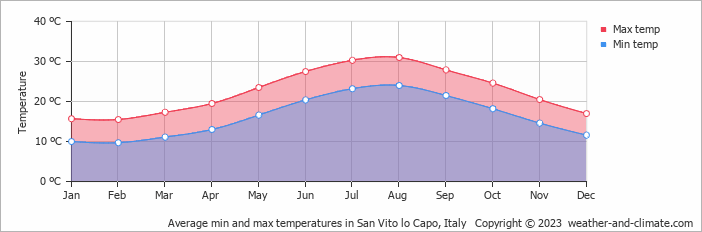
- The months of May, June, September, October and November have nice average temperatures.
- On average, the warmest month(s) are July and August.
- On average, the warmest month is August with 31°C.
- On average, the coolest month is February with 16°C.
- The average annual maximum temperature is 23°C.
- The average annual minimum temperature is 16°C.
Weather Forecasts for San Vito lo Capo
Fri Apr 19
16°C | 11°C
NW  50 km/h
50 km/h2.1 mm
partly cloudy and thunder
Sat Apr 20
17°C | 12°C
SW 36 km/h
36 km/hclear and no rain
Sun Apr 21
17°C | 13°C
NW 22 km/h
22 km/hbroken clouds and no rain


