ClimateForecastAprilMay >>

Average temperature in Railay Beach

The mean minimum and maximum temperatures over the year in Railay Beach (Krabi Province), Thailand.

Average monthly minimum and maximum temperature in Railay Beach,

Feel free to add this climate graph to your website. Click the copy button above.

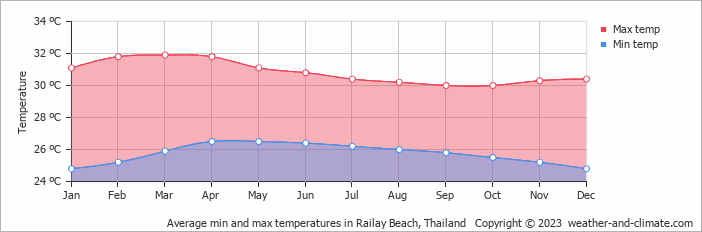
  • The months of September and October have nice average temperatures.
  • On average, the temperatures are always high.
  • On average, the warmest month is March with 32°C.
  • On average, the coolest month is October with 30°C.
  • The average annual maximum temperature is 31°C.
  • The average annual minimum temperature is 26°C.

Weather Forecasts for Railay Beach

Sat   Apr 20
36°C | 25°C
W 14 km/h
8.2 mm
broken clouds and thunder

broken clouds and thunder

Sun   Apr 21
35°C | 26°C
NW 11 km/h
4.9 mm
broken clouds and thunder

broken clouds and thunder

Mon   Apr 22
35°C | 26°C
W 11 km/h
1.3 mm
partly cloudy and rain

partly cloudy and rain

Interested in more climate information?

Weather and Climate provides you with all the information you need about the climate in Railay Beach.

Our site offers climate and forecast data for every country in the world. Are you going to Thailand? On this website you can find historical weather averages for many cities in Thailand. Not sure yet where to go? We now have a tool which recommends destinations that suit your ideal climate conditions. Find out where to go with our weather planner.

)