ClimateForecastAprilMay >>

Average temperature in Praia da Rocha

The mean minimum and maximum temperatures over the year in Praia da Rocha (Algarve), Portugal.

Average monthly minimum and maximum temperature in Praia da Rocha,

Feel free to add this climate graph to your website. Click the copy button above.

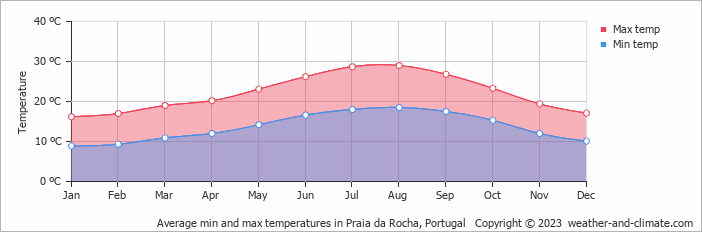
  • On average, the warmest month(s) are July and August.
  • On average, the warmest month is August with 29°C.
  • On average, the coolest month is January with 16°C.
  • The average annual maximum temperature is 22°C.
  • The average annual minimum temperature is 14°C.

Weather Forecasts for Praia da Rocha

Sat   Apr 20
21°C | 12°C
SE 22 km/h
broken clouds and no rain

broken clouds and no rain

Sun   Apr 21
21°C | 13°C
SE 14 km/h
almost clear and no rain

almost clear and no rain

Mon   Apr 22
25°C | 12°C
NW 14 km/h
0.2 mm
partly cloudy and small chance of slight rain

partly cloudy and small chance of slight rain

Interested in more climate information?

Weather and Climate provides you with all the information you need about the climate in Praia da Rocha.

Our site offers climate and forecast data for every country in the world. Are you going to Portugal? On this website you can find historical weather averages for many cities in Portugal. Not sure yet where to go? We now have a tool which recommends destinations that suit your ideal climate conditions. Find out where to go with our weather planner.

)