Average temperature in Playa Blanca
The mean minimum and maximum temperatures over the year in Playa Blanca (), Colombia.
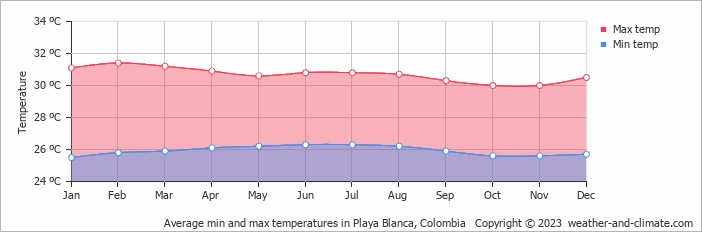
- The months of October and November have nice average temperatures.
- On average, the temperatures are always high.
- On average, the warmest month is February with 31°C.
- On average, the coolest month is October with 30°C.
- The average annual maximum temperature is 31°C.
- The average annual minimum temperature is 26°C.
Weather Forecasts for Playa Blanca
Fri Apr 26
31°C | 26°C
S  14 km/h
14 km/h32 mm
broken clouds and rain
Sat Apr 27
31°C | 26°C
S 14 km/h
14 km/h6.7 mm
broken clouds and thunder
Sun Apr 28
31°C | 25°C
S 22 km/h
22 km/h16 mm
broken clouds and thunder