ClimateForecastAprilMay >>

Average temperature in Pittsburg (CA)

The mean minimum and maximum temperatures over the year in Pittsburg (California), the United States of America.

Average monthly minimum and maximum temperature in Pittsburg (CA),

Feel free to add this climate graph to your website. Click the copy button above.

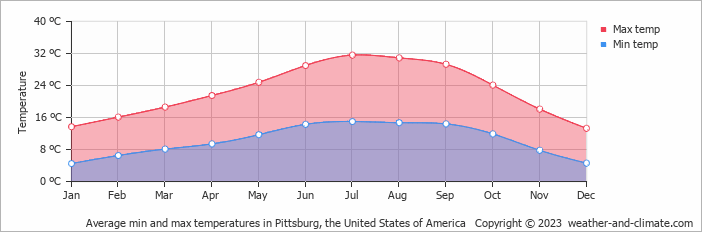
  • The months of April, May, June, September and October have nice average temperatures.
  • Hot season / summer is in June, July, August and September.
  • On average, the warmest month is July with 32°C.
  • On average, the coolest month is December with 13°C.
  • The average annual maximum temperature is 23°C.
  • The average annual minimum temperature is 10°C.

Weather Forecasts for Pittsburg (CA)

Tue   Apr 16
23°C | 10°C
W 11 km/h
almost clear and no rain

almost clear and no rain

Wed   Apr 17
25°C | 11°C
NE 7 km/h
broken clouds and no rain

broken clouds and no rain

Thu   Apr 18
26°C | 12°C
W 14 km/h
broken clouds and no rain

broken clouds and no rain

Interested in more climate information?

Weather and Climate provides you with all the information you need about the climate in Pittsburg.

Our site offers climate and forecast data for every country in the world. Are you going to the United States of America? On this website you can find historical weather averages for many cities in the United States of America. Not sure yet where to go? We now have a tool which recommends destinations that suit your ideal climate conditions. Find out where to go with our weather planner.

)