ClimateForecastAprilMay >>

Average temperature in Muri

The mean minimum and maximum temperatures over the year in Muri (), the Cook Islands.

Average monthly minimum and maximum temperature in Muri,

Feel free to add this climate graph to your website. Click the copy button above.

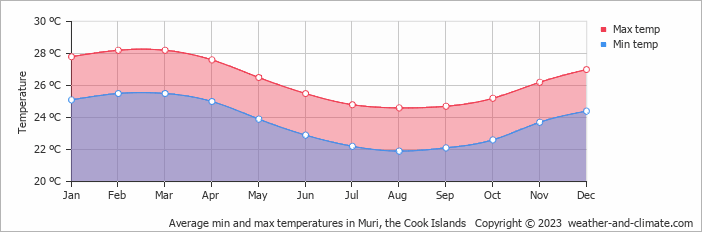
  • On average, the warmest month(s) are February and March.
  • On average, the warmest month is March with 28°C.
  • On average, the coolest month is August with 25°C.
  • The average annual maximum temperature is 26°C.
  • The average annual minimum temperature is 24°C.

Weather Forecasts for Muri

Tue   Apr 16
29°C | 25°C
E 29 km/h
2.5 mm
partly cloudy and rain

partly cloudy and rain

Wed   Apr 17
29°C | 26°C
E 25 km/h
1.1 mm
partly cloudy and  chance of slight rain

partly cloudy and chance of slight rain

Thu   Apr 18
29°C | 25°C
E 22 km/h
6.8 mm
partly cloudy and  chance of rain

partly cloudy and chance of rain

Interested in more climate information?

Weather and Climate provides you with all the information you need about the climate in Muri.

Our site offers climate and forecast data for every country in the world. Are you going to the Cook Islands? On this website you can find historical weather averages for many cities in the Cook Islands. Not sure yet where to go? We now have a tool which recommends destinations that suit your ideal climate conditions. Find out where to go with our weather planner.

)