Average temperature in Murcia
The mean minimum and maximum temperatures over the year in Murcia (Murcia), Spain.
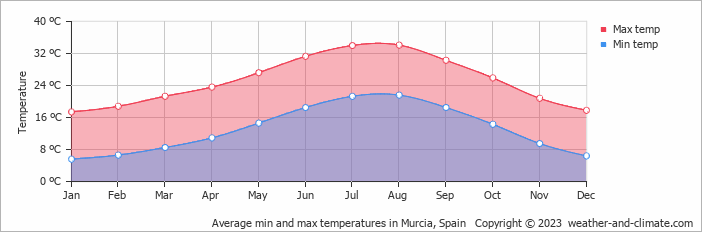
- The months of March, April, May, October and November have nice average temperatures.
- Hot season / summer is in June, July, August and September.
- On average, the warmest month is August with 34°C.
- On average, the coolest month is January with 17°C.
- The average annual maximum temperature is 25°C.
- The average annual minimum temperature is 13°C.
Weather Forecasts for Murcia
Thu Apr 25
24°C | 9°C
S  14 km/h
14 km/hpartly cloudy and no rain
Fri Apr 26
26°C | 12°C
SE 18 km/h
18 km/hpartly cloudy and no rain
Sat Apr 27
25°C | 12°C
SW 18 km/h
18 km/hpartly cloudy and no rain


