ClimateForecastAprilMay >>

Average temperature in Machachi

The mean minimum and maximum temperatures over the year in Machachi (), Ecuador.

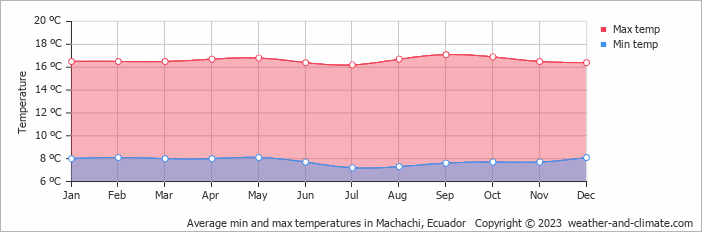
  • On average, the warmest month is September with 17°C.
  • On average, the coolest month is July with 16°C.
  • The average annual maximum temperature is 17°C.
  • The average annual minimum temperature is 8°C.

Weather Forecasts for Machachi

Thu   Apr 25
21°C | 9°C
S 7 km/h
2.4 mm
broken clouds and rain

broken clouds and rain

Fri   Apr 26
20°C | 10°C
NW 4 km/h
11 mm
broken clouds and thunder

broken clouds and thunder

Sat   Apr 27
19°C | 10°C
SE 7 km/h
16 mm
broken clouds and thunder

broken clouds and thunder

Interested in more climate information?

Weather and Climate provides you with all the information you need about the climate in Machachi.

Our site offers climate and forecast data for every country in the world. Are you going to Ecuador? On this website you can find historical weather averages for many cities in Ecuador. Not sure yet where to go? We now have a tool which recommends destinations that suit your ideal climate conditions. Find out where to go with our weather planner.

)