ClimateForecastAprilMay >>

Average temperature in Las Grutas

The mean minimum and maximum temperatures over the year in Las Grutas (Río Negro), Argentina.

Average monthly minimum and maximum temperature in Las Grutas,

Feel free to add this climate graph to your website. Click the copy button above.

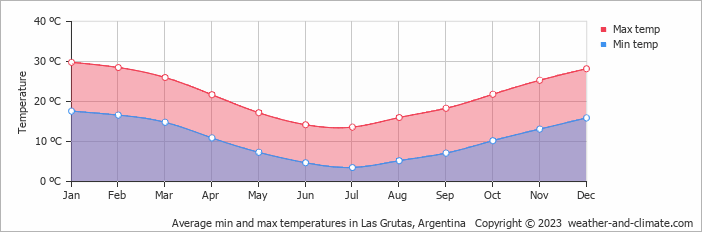
  • On average, the warmest month(s) are January, February and December.
  • On average, the warmest month is January with 30°C.
  • On average, the coolest month is July with 14°C.
  • The average annual maximum temperature is 22°C.
  • The average annual minimum temperature is 11°C.

Weather Forecasts for Las Grutas

Tue   Apr 16
23°C | 13°C
SW 36 km/h
25 mm
broken clouds and rain

broken clouds and rain

Wed   Apr 17
21°C | 9°C
SW 25 km/h
clear and no rain

clear and no rain

Thu   Apr 18
24°C | 7°C
N 29 km/h
broken clouds and no rain

broken clouds and no rain

Interested in more climate information?

Weather and Climate provides you with all the information you need about the climate in Las Grutas.

Our site offers climate and forecast data for every country in the world. Are you going to Argentina? On this website you can find historical weather averages for many cities in Argentina. Not sure yet where to go? We now have a tool which recommends destinations that suit your ideal climate conditions. Find out where to go with our weather planner.

)