Average temperature in Hardenberg

The mean minimum and maximum temperatures over the year in Hardenberg (Overijssel), the Netherlands.

Average monthly minimum and maximum temperature in Hardenberg,

Feel free to add this climate graph to your website. Click the copy button above.

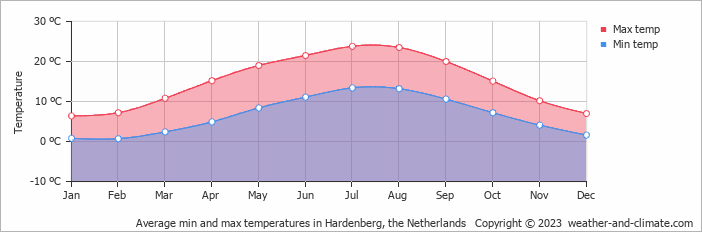
  • The months of June, July, August and September have nice average temperatures.
  • On average, the warmest month is July with 24°C.
  • On average, the coolest month is January with 6°C.
  • The average annual maximum temperature is 15°C.
  • The average annual minimum temperature is 7°C.

Weather Forecasts for Hardenberg

Tue   Mar 19
15°C | 5°C
SW 14 km/h
broken clouds and no rain

broken clouds and no rain

Wed   Mar 20
16°C | 7°C
SW 14 km/h
overcast and no rain

overcast and no rain

Thu   Mar 21
12°C | 7°C
NW 14 km/h
0.7 mm
overcast and  chance of slight rain

overcast and chance of slight rain

Interested in more climate information?

Weather and Climate provides you with all the information you need about the climate in Hardenberg.

Our site offers climate and forecast data for every country in the world. Are you going to the Netherlands? On this website you can find historical weather averages for many cities in the Netherlands. Not sure yet where to go? We now have a tool which recommends destinations that suit your ideal climate conditions. Find out where to go with our weather planner.

)