ClimateForecastAprilMay >>

Average temperature in Erice

The mean minimum and maximum temperatures over the year in Erice (Sicily), Italy.

Average monthly minimum and maximum temperature in Erice,

Feel free to add this climate graph to your website. Click the copy button above.

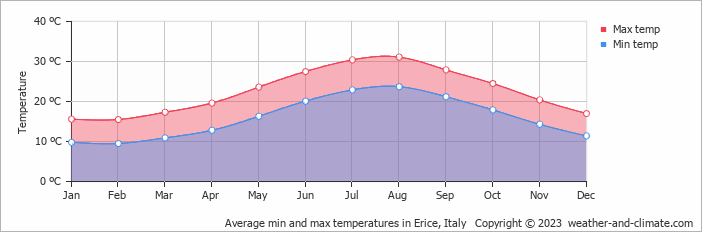
  • The months of May, June, September, October and November have nice average temperatures.
  • On average, the warmest month(s) are July and August.
  • On average, the warmest month is August with 31°C.
  • On average, the coolest month is February with 16°C.
  • The average annual maximum temperature is 23°C.
  • The average annual minimum temperature is 16°C.

Weather Forecasts for Erice

Thu   Apr 18
15°C | 9°C
W 32 km/h
almost clear and no rain

almost clear and no rain

Fri   Apr 19
12°C | 6°C
NW 40 km/h
8.9 mm
partly cloudy and rain

partly cloudy and rain

Sat   Apr 20
15°C | 4°C
W 29 km/h
clear and no rain

clear and no rain

Interested in more climate information?

Weather and Climate provides you with all the information you need about the climate in Erice.

Our site offers climate and forecast data for every country in the world. Are you going to Italy? On this website you can find historical weather averages for many cities in Italy. Not sure yet where to go? We now have a tool which recommends destinations that suit your ideal climate conditions. Find out where to go with our weather planner.

)