ClimateForecastAprilMay >>

Average temperature in Chioggia

The mean minimum and maximum temperatures over the year in Chioggia (Veneto), Italy.

Average monthly minimum and maximum temperature in Chioggia,

Feel free to add this climate graph to your website. Click the copy button above.

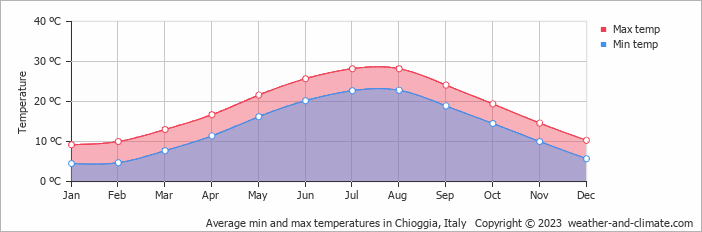
  • The months of May, June, July, August and September have nice average temperatures.
  • On average, the warmest month(s) are July and August.
  • On average, the warmest month is August with 28°C.
  • On average, the coolest month is January with 9°C.
  • The average annual maximum temperature is 18°C.
  • The average annual minimum temperature is 13°C.

Weather Forecasts for Chioggia

Fri   Apr 19
17°C | 10°C
SW 18 km/h
0.2 mm
partly cloudy and small chance of slight rain

partly cloudy and small chance of slight rain

Sat   Apr 20
15°C | 6°C
NE 29 km/h
0.7 mm
partly cloudy and  chance of slight rain

partly cloudy and chance of slight rain

Sun   Apr 21
14°C | 9°C
E 14 km/h
0.3 mm
partly cloudy and small chance of slight rain

partly cloudy and small chance of slight rain

Interested in more climate information?

Weather and Climate provides you with all the information you need about the climate in Chioggia.

Our site offers climate and forecast data for every country in the world. Are you going to Italy? On this website you can find historical weather averages for many cities in Italy. Not sure yet where to go? We now have a tool which recommends destinations that suit your ideal climate conditions. Find out where to go with our weather planner.

)