Average temperature in Casares de las Hurdes
The mean minimum and maximum temperatures over the year in Casares de las Hurdes (), Spain.
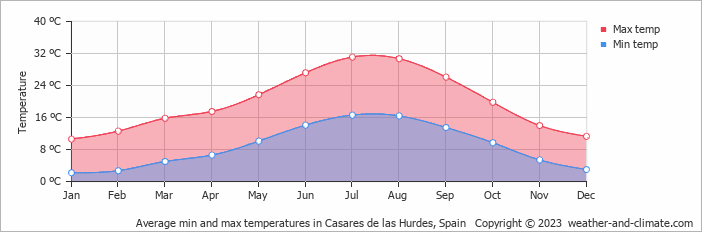
- The months of May, June and September have nice average temperatures.
- On average, the warmest month(s) are July and August.
- On average, the warmest month is July with 31°C.
- On average, the coolest month is January with 11°C.
- The average annual maximum temperature is 20°C.
- The average annual minimum temperature is 9°C.
Weather Forecasts for Casares de las Hurdes
Wed Apr 24
19°C | 4°C
NW  11 km/h
11 km/hpartly cloudy and no rain
Thu Apr 25
15°C | 6°C
NW 18 km/h
18 km/hpartly cloudy and no rain
Fri Apr 26
12°C | 4°C
SW 22 km/h
22 km/h1.5 mm
overcast and slight rain


