Average temperature in Burgerbrug
The mean minimum and maximum temperatures over the year in Burgerbrug (Noord-Holland), the Netherlands.
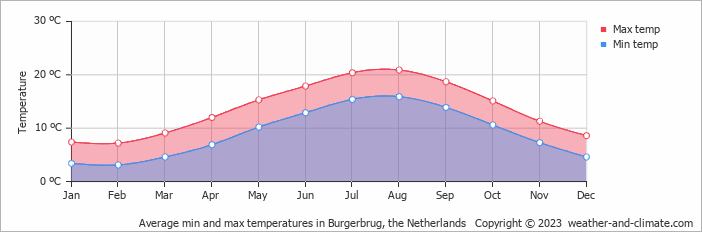
- The months of July and August have nice average temperatures.
- On average, the warmest month is August with 21°C.
- On average, the coolest month is February with 7°C.
- The average annual maximum temperature is 14°C.
- The average annual minimum temperature is 9°C.
Weather Forecasts for Burgerbrug
Fri Apr 26
10°C | 3°C
W  14 km/h
14 km/hpartly cloudy and no rain
Sat Apr 27
15°C | 2°C
SE 14 km/h
14 km/h4.5 mm
overcast and heavy rain
Sun Apr 28
16°C | 9°C
SW 36 km/h
36 km/h2 mm
partly cloudy and rain


