ClimateForecastAprilMay >>

Average temperature in Burg-Reuland

The mean minimum and maximum temperatures over the year in Burg-Reuland (Liege Province), Belgium.

Average monthly minimum and maximum temperature in Burg-Reuland,

Feel free to add this climate graph to your website. Click the copy button above.

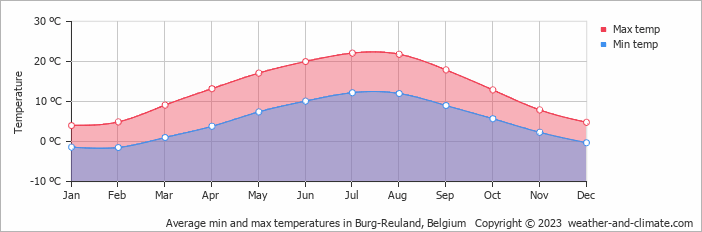
  • The months of June, July and August have nice average temperatures.
  • On average, the warmest month is July with 22°C.
  • On average, the coolest month is January with 4°C.
  • The average annual maximum temperature is 13°C.
  • The average annual minimum temperature is 5°C.

Weather Forecasts for Burg-Reuland

Tue   Apr 16
7°C | 1°C
W 36 km/h
10 mm
overcast and heavy rain

overcast and heavy rain

Wed   Apr 17
6°C | 1°C
NW 14 km/h
2.1 mm
overcast and rain

overcast and rain

Thu   Apr 18
7°C | 0°C
N 22 km/h
0.4 mm
broken clouds and slight rain

broken clouds and slight rain

Interested in more climate information?

Weather and Climate provides you with all the information you need about the climate in Burg-Reuland.

Our site offers climate and forecast data for every country in the world. Are you going to Belgium? On this website you can find historical weather averages for many cities in Belgium. Not sure yet where to go? We now have a tool which recommends destinations that suit your ideal climate conditions. Find out where to go with our weather planner.

)