Average temperature in Bolilmark
The mean minimum and maximum temperatures over the year in Bolilmark (Syddanmark), Denmark.
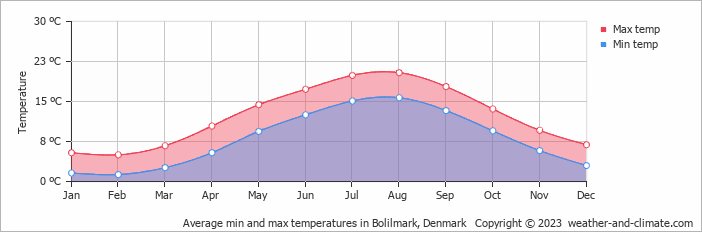
- On average, the warmest month is August with 20°C.
- On average, the coolest month is February with 5°C.
- The average annual maximum temperature is 12°C.
- The average annual minimum temperature is 8°C.
Weather Forecasts for Bolilmark
Thu Apr 25
8°C | 3°C
SW  14 km/h
14 km/h0.3 mm
overcast and slight rain
Fri Apr 26
9°C | 3°C
E 18 km/h
18 km/h4 mm
broken clouds and chance of rain
Sat Apr 27
13°C | 4°C
E 18 km/h
18 km/h0.1 mm
overcast and chance of slight rain


