Average temperature in Barra de Chapagua
The mean minimum and maximum temperatures over the year in Barra de Chapagua (), Honduras.
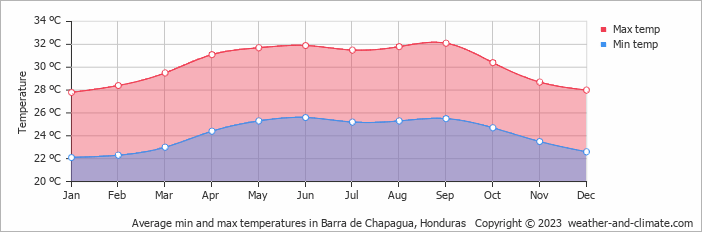
- The months of January, February, March, November and December have nice average temperatures.
- On average, the temperatures are always high.
- On average, the warmest month is September with 32°C.
- On average, the coolest month is January with 28°C.
- The average annual maximum temperature is 30°C.
- The average annual minimum temperature is 24°C.
Weather Forecasts for Barra de Chapagua
Wed Apr 24
33°C | 23°C
NE  18 km/h
18 km/halmost clear and no rain
Thu Apr 25
33°C | 24°C
NE 18 km/h
18 km/h1.1 mm
partly cloudy and chance of slight rain
Fri Apr 26
33°C | 22°C
NE 18 km/h
18 km/h0.7 mm
partly cloudy and chance of rain