Average temperature in Bahawalpur
The mean minimum and maximum temperatures over the year in Bahawalpur (), Pakistan.
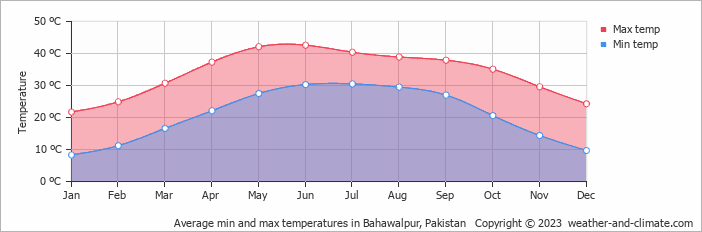
- The months of January, February, November and December have nice average temperatures.
- Hot season / summer is in March, April, May, June, July, August, September, October and November.
- On average, the warmest month is June with 43°C.
- On average, the coolest month is January with 22°C.
- The average annual maximum temperature is 34°C.
- The average annual minimum temperature is 21°C.
Weather Forecasts for Bahawalpur
Sat Apr 20
34°C | 20°C
N  14 km/h
14 km/hclear and no rain
Sun Apr 21
35°C | 20°C
W 11 km/h
11 km/halmost clear and no rain
Mon Apr 22
36°C | 20°C
W 11 km/h
11 km/halmost clear and no rain