ClimateForecastAprilMay >>

Average temperature in Piura

The mean minimum and maximum temperatures over the year in Piura (Piura), Peru.

Average monthly minimum and maximum temperature in Piura,

Feel free to add this climate graph to your website. Click the copy button above.

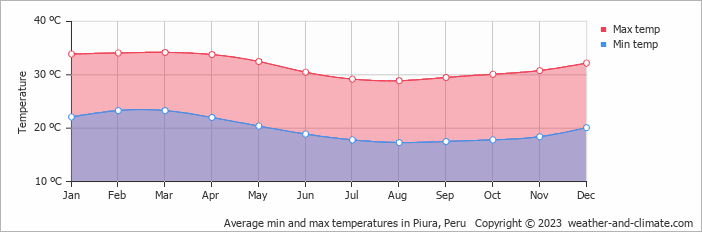
  • The months of July, August and September have nice average temperatures.
  • On average, the temperatures are always high.
  • On average, the warmest month is March with 34°C.
  • On average, the coolest month is August with 29°C.
  • The average annual maximum temperature is 32°C.
  • The average annual minimum temperature is 20°C.

Weather Forecasts for Piura

Thu   Apr 18
34°C | 21°C
SW 25 km/h
partly cloudy and no rain

partly cloudy and no rain

Fri   Apr 19
34°C | 22°C
SW 25 km/h
broken clouds and no rain

broken clouds and no rain

Sat   Apr 20
33°C | 22°C
SW 22 km/h
2.9 mm
partly cloudy and  chance of rain

partly cloudy and chance of rain

Interested in more climate information?

Weather and Climate provides you with all the information you need about the climate in Piura.

Our site offers climate and forecast data for every country in the world. Are you going to Peru? On this website you can find historical weather averages for many cities in Peru. Not sure yet where to go? We now have a tool which recommends destinations that suit your ideal climate conditions. Find out where to go with our weather planner.

)