ClimateForecastAprilMay >>

Average temperature in Macapá

The mean minimum and maximum temperatures over the year in Macapá (Amapá), Brazil.

Average monthly minimum and maximum temperature in Macapá,

Feel free to add this climate graph to your website. Click the copy button above.

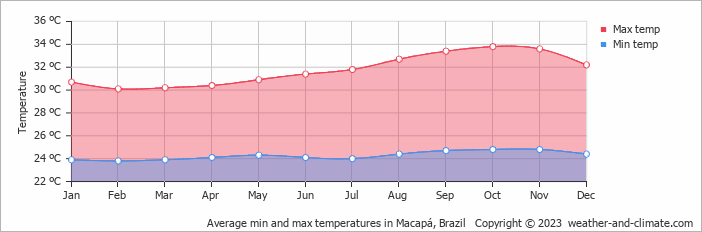
  • On average, the temperatures are always high.
  • On average, the warmest month is October with 34°C.
  • On average, the coolest month is February with 30°C.
  • The average annual maximum temperature is 32°C.
  • The average annual minimum temperature is 24°C.

Weather Forecasts for Macapá

Thu   Apr 18
32°C | 25°C
NE 14 km/h
14 mm
broken clouds and thunder

broken clouds and thunder

Fri   Apr 19
31°C | 25°C
NE 11 km/h
6.4 mm
broken clouds and rain

broken clouds and rain

Sat   Apr 20
32°C | 25°C
E 14 km/h
8.3 mm
broken clouds and thunder

broken clouds and thunder

Interested in more climate information?

Weather and Climate provides you with all the information you need about the climate in Macapá.

Our site offers climate and forecast data for every country in the world. Are you going to Brazil? On this website you can find historical weather averages for many cities in Brazil. Not sure yet where to go? We now have a tool which recommends destinations that suit your ideal climate conditions. Find out where to go with our weather planner.

)