Average temperature in Kufra
The mean minimum and maximum temperatures over the year in Kufra (), Libya.
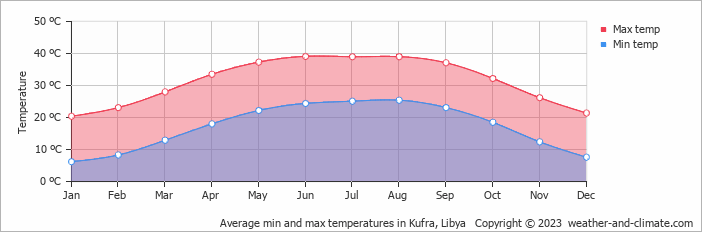
- The months of January, February, March, November and December have nice average temperatures.
- Hot season / summer is in March, April, May, June, July, August, September and October.
- On average, the warmest month is June with 39°C.
- On average, the coolest month is January with 20°C.
- The average annual maximum temperature is 31°C.
- The average annual minimum temperature is 17°C.
Weather Forecasts for Kufra
Tue Apr 16
38°C | 19°C
SE  18 km/h
18 km/hpartly cloudy and no rain
Wed Apr 17
36°C | 23°C
NW 25 km/h
25 km/hclear and no rain
Thu Apr 18
34°C | 19°C
NE 25 km/h
25 km/hclear and no rain