ClimateForecastAprilMay >>

Average temperature in Kermadec

The mean minimum and maximum temperatures over the year in Kermadec (), Kermadec Islands.

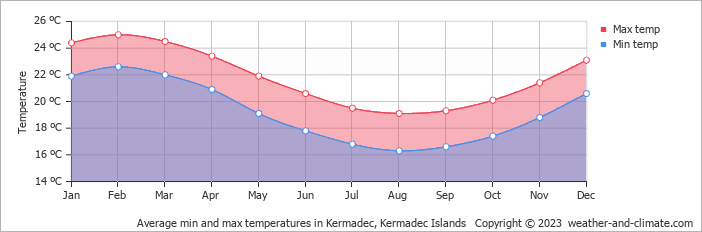
  • On average, the warmest month is February with 25°C.
  • On average, the coolest month is August with 19°C.
  • The average annual maximum temperature is 22°C.
  • The average annual minimum temperature is 19°C.

Weather Forecasts for Kermadec

Sat   Apr 27
24°C | 20°C
S 25 km/h
broken clouds and no rain

broken clouds and no rain

Sun   Apr 28
24°C | 19°C
SE 47 km/h
5.1 mm
overcast and rain

overcast and rain

Mon   Apr 29
25°C | 19°C
SE 43 km/h
97 mm
broken clouds and thunder

broken clouds and thunder

Interested in more climate information?

Weather and Climate provides you with all the information you need about the climate in Kermadec.

Our site offers climate and forecast data for every country in the world. Are you going to Kermadec Islands? On this website you can find historical weather averages for many cities in Kermadec Islands. Not sure yet where to go? We now have a tool which recommends destinations that suit your ideal climate conditions. Find out where to go with our weather planner.

)