Average temperature in Cajamarca
The mean minimum and maximum temperatures over the year in Cajamarca (Cajamarca), Peru.
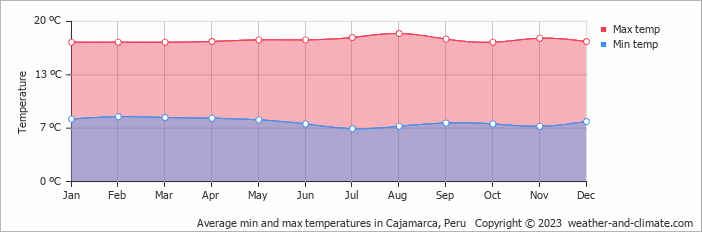
- On average, the warmest month is August with 19°C.
- On average, the coolest month is January with 17°C.
- The average annual maximum temperature is 18°C.
- The average annual minimum temperature is 7°C.
Weather Forecasts for Cajamarca
Wed Apr 24
22°C | 7°C
SE  11 km/h
11 km/hbroken clouds and no rain
Thu Apr 25
22°C | 8°C
SE 11 km/h
11 km/h8.8 mm
broken clouds and thunder
Fri Apr 26
22°C | 10°C
SW 11 km/h
11 km/h7.7 mm
broken clouds and thunder


