Average temperature in Batouri

The mean minimum and maximum temperatures over the year in Batouri (), Cameroon.

Average monthly minimum and maximum temperature in Batouri,

Feel free to add this climate graph to your website. Click the copy button above.

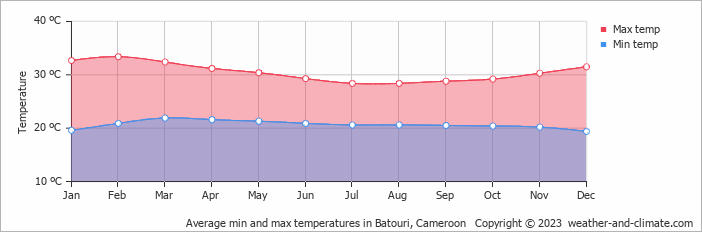
  • The months of June, July, August, September and October have nice average temperatures.
  • On average, the temperatures are always high.
  • On average, the warmest month is February with 33°C.
  • On average, the coolest month is August with 28°C.
  • The average annual maximum temperature is 31°C.
  • The average annual minimum temperature is 21°C.

Weather Forecasts for Batouri

Tue   Mar 19
31°C | 21°C
NE 4 km/h
0.8 mm
broken clouds and small chance of rain

broken clouds and small chance of rain

Wed   Mar 20
30°C | 22°C
SW 7 km/h
3.5 mm
partly cloudy and thunder

partly cloudy and thunder

Thu   Mar 21
33°C | 22°C
SW 7 km/h
0.7 mm
broken clouds and small chance of slight rain

broken clouds and small chance of slight rain

Interested in more climate information?

Weather and Climate provides you with all the information you need about the climate in Batouri.

Our site offers climate and forecast data for every country in the world. Are you going to Cameroon? On this website you can find historical weather averages for many cities in Cameroon. Not sure yet where to go? We now have a tool which recommends destinations that suit your ideal climate conditions. Find out where to go with our weather planner.

)