ClimateForecastAprilMay >>

Average temperature in Banc d'Arguin National Park

The mean minimum and maximum temperatures over the year in Banc d'Arguin National Park (), Mauritania.

Average monthly minimum and maximum temperature in Banc d'Arguin National Park,
' disabled />

Feel free to add this climate graph to your website. Click the copy button above.

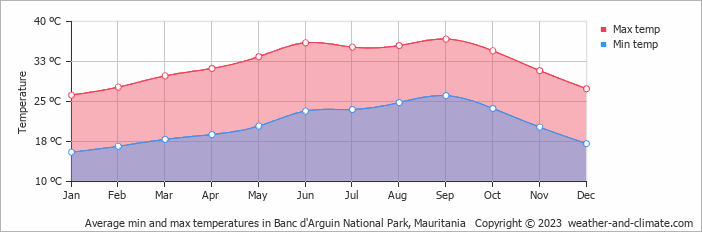
  • The months of January, February, March and December have nice average temperatures.
  • On average, the temperatures are always high.
  • On average, the warmest month is September with 37°C.
  • On average, the coolest month is January with 26°C.
  • The average annual maximum temperature is 32°C.
  • The average annual minimum temperature is 21°C.

Weather Forecasts for Banc d'Arguin National Park

Sat   Apr 20
39°C | 20°C
NW 25 km/h
broken clouds and no rain

broken clouds and no rain

Sun   Apr 21
38°C | 20°C
NE 25 km/h
clear and no rain

clear and no rain

Mon   Apr 22
38°C | 20°C
NE 22 km/h
almost clear and no rain

almost clear and no rain

Interested in more climate information?

Weather and Climate provides you with all the information you need about the climate in Banc d'Arguin National Park.

Our site offers climate and forecast data for every country in the world. Are you going to Mauritania? On this website you can find historical weather averages for many cities in Mauritania. Not sure yet where to go? We now have a tool which recommends destinations that suit your ideal climate conditions. Find out where to go with our weather planner.

)