ClimateForecastAprilMay >>

Climate in Wijk aan Zee (Noord-Holland), Netherlands

The graphs below show the monthly weather averages over the year.

Average day and night temperature

The mean minimum and maximum temperatures over the year.

Average monthly minimum and maximum temperature in Wijk aan Zee, the Netherlands

Feel free to add this climate graph to your website. Click the copy button above.

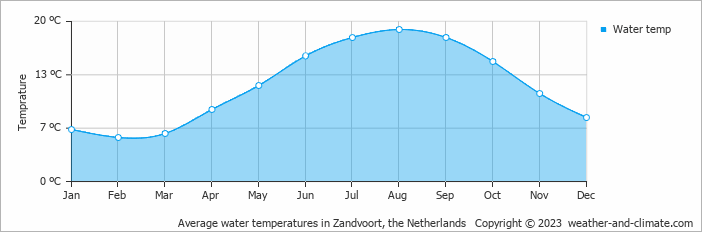
Average water temperature

The mean water temperature over the year.

Average monthly water temperature in Wijk aan Zee, the Netherlands

Feel free to add this climate graph to your website. Click the copy button above.

* Data from: Zandvoort, the Netherlands (14 KM, 8 Miles).

Monthly precipitation

The mean monthly precipitation over the year, including rain, snow, hail etc.

Average monthly rainfall, snow, precipitation in Wijk aan Zee, the Netherlands

Feel free to add this climate graph to your website. Click the copy button above.

Monthly rainy days

The average number of days each month with rain, snow, hail etc.

Average monthly rainy days in Wijk aan Zee, the Netherlands

Feel free to add this climate graph to your website. Click the copy button above.

Weather Forecasts for Wijk aan Zee

Tue   Apr 16
11°C | 6°C
NW 47 km/h
5.7 mm
broken clouds and rain

broken clouds and rain

Wed   Apr 17
9°C | 4°C
N 22 km/h
5.9 mm
partly cloudy and rain

partly cloudy and rain

Thu   Apr 18
10°C | 4°C
NW 25 km/h
1.4 mm
broken clouds and small chance of slight rain

broken clouds and small chance of slight rain

The best time of year to visit Wijk aan Zee in the Netherlands

Wijk aan Zee is a surfer town the Netherlands with a sea Climate. In winter people walk their dogs on the beach, so it is visited throughout the year. During summer Wijk aan Zee is filled with local people and tourist who enjoy the beach. Best time to go is in summer which is in the months July and August and the beginning of September.

During the months of July and August you are most likely to experience good weather with pleasant average temperatures that fall between 20°C and 26°C.

Other facts from our historical weather data:

  • Which is the warmest month in Wijk aan Zee?
    August has an average maximum temperature of 21°C and is the warmest month of the year.
  • Which is the coldest month in Wijk aan Zee?
    The coldest month is February with an average maximum temperature of 7°C.
  • Which is the wettest month in Wijk aan Zee?
    October tops the wettest month list with 116 mm of rainfall.
  • Which is the driest month in Wijk aan Zee?
    April is the driest month with 51 mm of precipitation.

  • No idea where to travel to this year? We have a tool that recommends destinations based on your ideal conditions. Find out where to go with our weather planner.