ClimateForecastAprilMay >>

Climate in San José del Sur, Nicaragua

The graphs below show the monthly weather averages over the year.

Average day and night temperature

The mean minimum and maximum temperatures over the year.

Average monthly minimum and maximum temperature in San José del Sur, Nicaragua

Feel free to add this climate graph to your website. Click the copy button above.

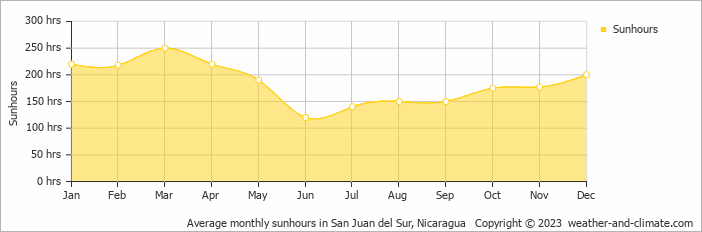
Monthly hours of sunshine

The average monthly total hours of sunshine over the year

Average monthly hours of sunshine in San José del Sur, Nicaragua

Feel free to add this climate graph to your website. Click the copy button above.

* Data from: San Juan del Sur, Nicaragua (35 KM, 21 Miles).

Monthly precipitation

The mean monthly precipitation over the year, including rain, snow, hail etc.

Average monthly rainfall, snow, precipitation in San José del Sur, Nicaragua

Feel free to add this climate graph to your website. Click the copy button above.

Monthly rainy days

The average number of days each month with rain, snow, hail etc.

Average monthly rainy days in San José del Sur, Nicaragua

Feel free to add this climate graph to your website. Click the copy button above.

Weather Forecasts for San José del Sur

Wed   Apr 17
33°C | 26°C
E 25 km/h
almost clear and no rain

almost clear and no rain

Thu   Apr 18
33°C | 26°C
E 25 km/h
0.7 mm
partly cloudy and  chance of slight rain

partly cloudy and chance of slight rain

Fri   Apr 19
33°C | 26°C
E 22 km/h
partly cloudy and no rain

partly cloudy and no rain

The best time of year to visit San José del Sur in Nicaragua

San José del Sur has high temperatures year round ranging between 28°C and 30°C.
The best time to visit is during the drier months: February, March and April.

Other facts from our historical weather data:

  • When is the rainy season in San José del Sur?
    Rainy season in San José del Sur occurs in the months of May, June, July, August, September and October.
  • Which is the hottest month in San José del Sur?
    April has an average maximum temperature of 31°C and is the hottest month of the year.
  • Which is the coolest month in San José del Sur?
    The coolest month is January with an average maximum temperature of 29°C.
  • Which is the wettest month in San José del Sur?
    October tops the wettest month list with 303 mm of rainfall.
  • Which is the driest month in San José del Sur?
    March is the driest month with 25 mm of precipitation.
  • Which is the sunniest month in San José del Sur?
    March is the sunniest month with an average of 250 hours of sunshine.

  • No idea where to travel to this year? We have a tool that recommends destinations based on your ideal conditions. Find out where to go with our weather planner.