ClimateForecastAprilMay >>

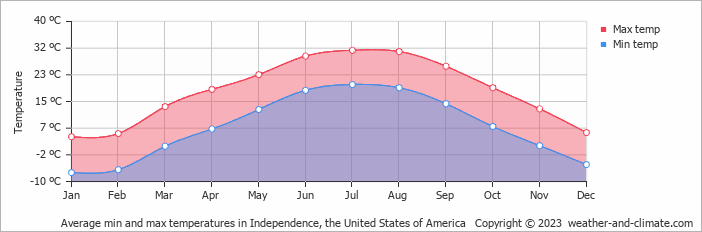
Climate in Independence (Missouri), United States of America

The graphs below show the monthly weather averages over the year.

Average day and night temperature

The mean minimum and maximum temperatures over the year.

Average monthly minimum and maximum temperature in Independence, the United States of America

Feel free to add this climate graph to your website. Click the copy button above.

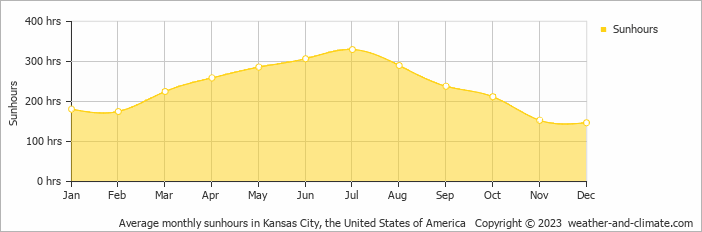
Monthly hours of sunshine

The average monthly total hours of sunshine over the year

Average monthly hours of sunshine in Independence, the United States of America

Feel free to add this climate graph to your website. Click the copy button above.

* Data from: Kansas City, the United States of America (12 KM, 7 Miles).

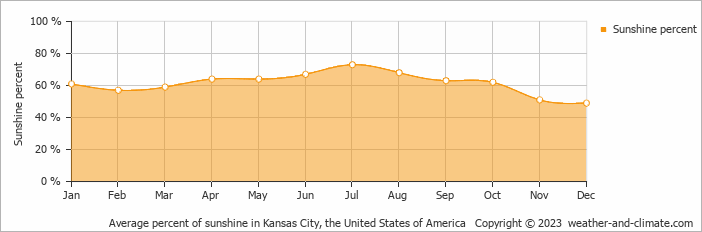
Daily percent of sunshine

The mean percent of hours of sunhours during the day over the year

Average monthly percentage of sunshine in Independence, the United States of America

Feel free to add this climate graph to your website. Click the copy button above.

* Data from: Kansas City, the United States of America (12 KM, 7 Miles).

Monthly precipitation

The mean monthly precipitation over the year, including rain, snow, hail etc.

Average monthly rainfall, snow, precipitation in Independence, the United States of America

Feel free to add this climate graph to your website. Click the copy button above.

Monthly rainy days

The average number of days each month with rain, snow, hail etc.

Average monthly rainy days in Independence, the United States of America

Feel free to add this climate graph to your website. Click the copy button above.

Average humidity

The mean monthly relative humidity over the year

Average monthly relative humidity in Independence, the United States of America

Feel free to add this climate graph to your website. Click the copy button above.

* Data from: Kansas City, the United States of America (12 KM, 7 Miles).

Weather Forecasts for Independence (MO)

Fri   Apr 19
16°C | 5°C
N 18 km/h
partly cloudy and no rain

partly cloudy and no rain

Sat   Apr 20
13°C | 6°C
NW 25 km/h
broken clouds and no rain

broken clouds and no rain

Sun   Apr 21
16°C | 4°C
NW 22 km/h
clear and no rain

clear and no rain

The best time of year to visit Independence in the United States of America

During the months of May and September you are most likely to experience good weather with pleasant average temperatures that fall between 20°C and 26°C.

Other facts from our historical weather data:

  • When is summer in Independence?
    The hottest season / summer takes place in June, July, August and September.
  • Which is the warmest month in Independence?
    July has an average maximum temperature of 31°C and is the warmest month of the year.
  • Which is the coldest month in Independence?
    The coldest month is January with an average maximum temperature of 4°C.
  • Which is the wettest month in Independence?
    May tops the wettest month list with 153 mm of rainfall.
  • Which is the driest month in Independence?
    January is the driest month with 24 mm of precipitation.
  • Which is the sunniest month in Independence?
    July is the sunniest month with an average of 330 hours of sunshine.

  • No idea where to travel to this year? We have a tool that recommends destinations based on your ideal conditions. Find out where to go with our weather planner.