ClimateForecastAprilMay >>

Climate in Chiang Khan (Loei Province), Thailand

The graphs below show the monthly weather averages over the year.

Average day and night temperature

The mean minimum and maximum temperatures over the year.

Average monthly minimum and maximum temperature in Chiang Khan, Thailand

Feel free to add this climate graph to your website. Click the copy button above.

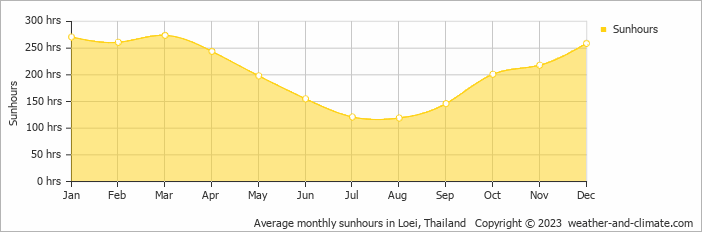
Monthly hours of sunshine

The average monthly total hours of sunshine over the year
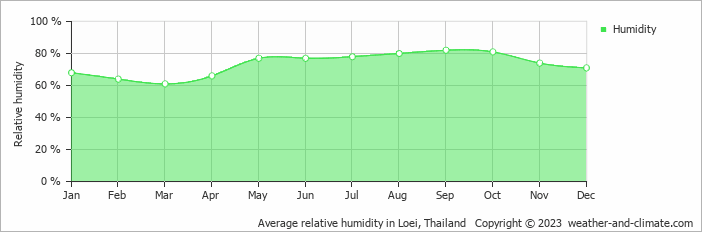
Average monthly hours of sunshine in Chiang Khan, Thailand

Feel free to add this climate graph to your website. Click the copy button above.

* Data from: Loei, Thailand (45 KM, 28 Miles).

Monthly precipitation

The mean monthly precipitation over the year, including rain, snow, hail etc.

Average monthly rainfall, snow, precipitation in Chiang Khan, Thailand

Feel free to add this climate graph to your website. Click the copy button above.

Monthly rainy days

The average number of days each month with rain, snow, hail etc.

Average monthly rainy days in Chiang Khan, Thailand

Feel free to add this climate graph to your website. Click the copy button above.

Average humidity

The mean monthly relative humidity over the year

Average monthly relative humidity in Chiang Khan, Thailand

Feel free to add this climate graph to your website. Click the copy button above.

* Data from: Loei, Thailand (45 KM, 28 Miles).

Weather Forecasts for Chiang Khan

Thu   Apr 18
41°C | 25°C
SW 11 km/h
almost clear and no rain

almost clear and no rain

Fri   Apr 19
41°C | 27°C
SW 11 km/h
almost clear and no rain

almost clear and no rain

Sat   Apr 20
40°C | 26°C
W 14 km/h
0.3 mm
partly cloudy and small chance of slight rain

partly cloudy and small chance of slight rain

The best time of year to visit Chiang Khan in Thailand

Other facts from our historical weather data:

  • When is the rainy season in Chiang Khan?
    Rainy season in Chiang Khan occurs in the months of May, June, July, August and September.
  • Does Chiang Khan have a dry season?
    Yes, the months of January, February and December are very dry.
  • Which is the hottest month in Chiang Khan?
    April has an average maximum temperature of 36°C and is the hottest month of the year.
  • Which is the coolest month in Chiang Khan?
    The coolest month is January with an average maximum temperature of 30°C.
  • Which is the wettest month in Chiang Khan?
    August tops the wettest month list with 276 mm of rainfall.
  • Which is the driest month in Chiang Khan?
    December is the driest month with 11 mm of precipitation.
  • Which is the sunniest month in Chiang Khan?
    March is the sunniest month with an average of 274 hours of sunshine.

  • No idea where to travel to this year? We have a tool that recommends destinations based on your ideal conditions. Find out where to go with our weather planner.