Monthly Average Rainy days in Redlynch
The number of days each month with rain, snow and hail in Redlynch (Queensland), Australia.
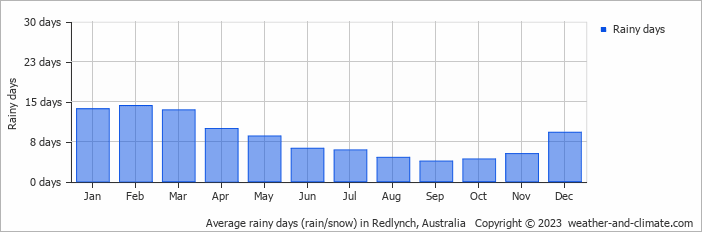
- On average, February is the most rainy with 14 days of rain/snow.
- On average, September is the driest month with 3 rainy days.
- The average annual number of rainy days is 98.
Current rainfall in Redlynch
Sat Nov 23
29°C | 23°C
SE  22 km/h
22 km/h2 mm
partly cloudy and rain
Sun Nov 24
31°C | 23°C
E 22 km/h
22 km/h2.7 mm
partly cloudy and rain
Mon Nov 25
31°C | 22°C
SE 18 km/h
18 km/h0.6 mm
partly cloudy and slight rain


