ClimateForecastAprilMay >>

Average monthly rainy days in Marbach

The number of days each month with rain, snow and hail in Marbach (Canton of Lucerne), Switzerland.

Average monthly rainy days in Marbach,

Feel free to add this climate graph to your website. Click the copy button above.

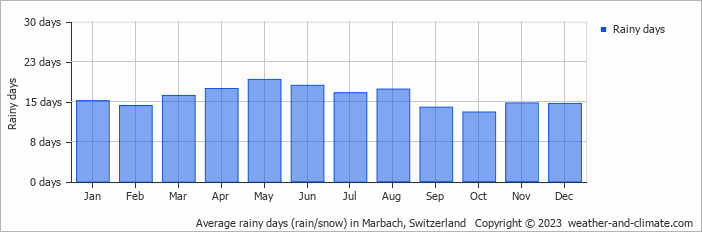
  • Most rainy days are in January, March, April, May, June, July and August.
  • On average, May is the most rainy with 19 days of rain/snow.
  • On average, October is the driest month with 13 rainy days.
  • The average annual number of rainy days is 189.

Weather Forecasts for Marbach

Fri   Apr 19
4°C | -3°C
W 14 km/h
15 mm
overcast and sleet

overcast and sleet

Sat   Apr 20
4°C | -1°C
NW 7 km/h
24 mm
broken clouds and sleet

broken clouds and sleet

Sun   Apr 21
3°C | -4°C
N 7 km/h
20 mm
overcast and heavy snow

overcast and heavy snow

Interested in more climate information?

Weather and Climate provides you with all the information you need about the climate in Marbach.

Our site offers climate and forecast data for every country in the world. Are you going to Switzerland? On this website you can find historical weather averages for many cities in Switzerland. Not sure yet where to go? We now have a tool which recommends destinations that suit your ideal climate conditions. Find out where to go with our weather planner.