Average monthly rainy days in Khinak

The number of days each month with rain, snow and hail in Khinak (Champasak), Laos.

Average monthly rainy days in Khinak,

Feel free to add this climate graph to your website. Click the copy button above.

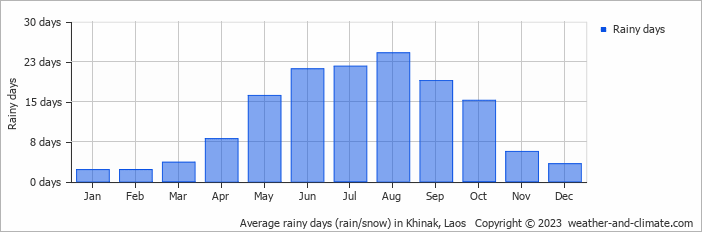
  • Most rainy days are in May, June, July, August, September and October.
  • On average, August is the most rainy with 24 days of rain/snow.
  • On average, January is the driest month with 2 rainy days.
  • The average annual number of rainy days is 141.

Weather Forecasts for Khinak

Thu   Mar 28
38°C | 27°C
SW 11 km/h
0.7 mm
broken clouds and small chance of rain

broken clouds and small chance of rain

Fri   Mar 29
37°C | 26°C
NE 14 km/h
12 mm
broken clouds and thunder

broken clouds and thunder

Sat   Mar 30
36°C | 25°C
SE 7 km/h
partly cloudy and no rain

partly cloudy and no rain

Interested in more climate information?

Weather and Climate provides you with all the information you need about the climate in Khinak.

Our site offers climate and forecast data for every country in the world. Are you going to Laos? On this website you can find historical weather averages for many cities in Laos. Not sure yet where to go? We now have a tool which recommends destinations that suit your ideal climate conditions. Find out where to go with our weather planner.