Average monthly rainy days in Chambok
The number of days each month with rain, snow and hail in Chambok (Kampong Cham Province), Cambodia.
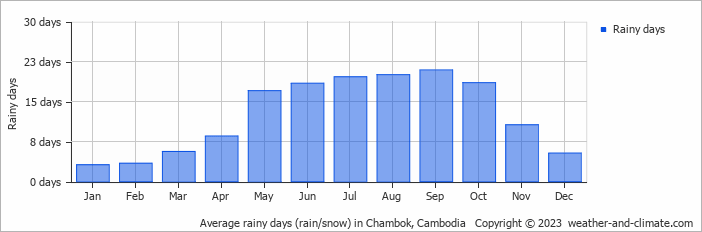
- Most rainy days are in May, June, July, August, September and October.
- On average, September is the most rainy with 20 days of rain/snow.
- On average, January is the driest month with 3 rainy days.
- The average annual number of rainy days is 150.
Weather Forecasts for Chambok
Wed Apr 24
39°C | 23°C
SE  14 km/h
14 km/hpartly cloudy and no rain
Thu Apr 25
40°C | 24°C
SW 11 km/h
11 km/h0.2 mm
partly cloudy and chance of slight rain
Fri Apr 26
37°C | 24°C
SW 14 km/h
14 km/h1.2 mm
partly cloudy and rain


