Average monthly rainy days in Montego Bay
The number of days each month with rain, snow and hail in Montego Bay (Saint James), Jamaica.
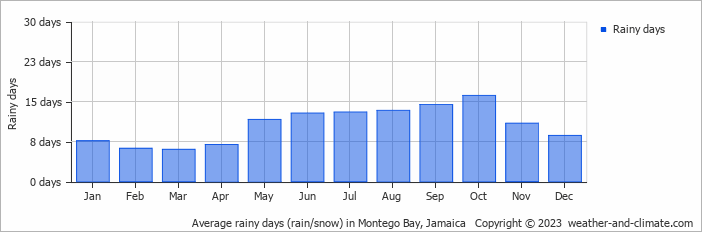
- Most rainy days are in October.
- On average, October is the most rainy with 16 days of rain/snow.
- On average, March is the driest month with 6 rainy days.
- The average annual number of rainy days is 127.
Weather Forecasts for Montego Bay
Tue Apr 23
33°C | 25°C
NE  25 km/h
25 km/halmost clear and no rain
Wed Apr 24
32°C | 25°C
E 32 km/h
32 km/halmost clear and no rain
Thu Apr 25
32°C | 26°C
NE 32 km/h
32 km/hclear and no rain


