ClimateForecastAprilMay >>

Climate in Trou aux Biches, Mauritius

The graphs below show the monthly weather averages over the year.

Average day and night temperature

The mean minimum and maximum temperatures over the year.

Average monthly minimum and maximum temperature in Trou aux Biches, Mauritius

Feel free to add this climate graph to your website. Click the copy button above.

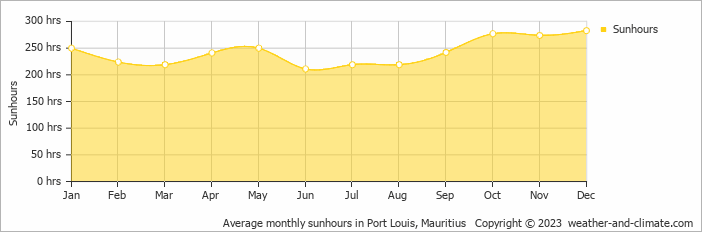
Monthly hours of sunshine

The average monthly total hours of sunshine over the year

Average monthly hours of sunshine in Trou aux Biches, Mauritius

Feel free to add this climate graph to your website. Click the copy button above.

* Data from: Port Louis, Mauritius (14 KM, 9 Miles).

Monthly precipitation

The mean monthly precipitation over the year, including rain, snow, hail etc.

Average monthly rainfall, snow, precipitation in Trou aux Biches, Mauritius

Feel free to add this climate graph to your website. Click the copy button above.

Monthly rainy days

The average number of days each month with rain, snow, hail etc.

Average monthly rainy days in Trou aux Biches, Mauritius

Feel free to add this climate graph to your website. Click the copy button above.

Weather Forecasts for Trou aux Biches

Sat   Apr 20
28°C | 23°C
E 25 km/h
0.5 mm
partly cloudy and slight rain

partly cloudy and slight rain

Sun   Apr 21
29°C | 23°C
E 18 km/h
9.9 mm
broken clouds and thunder

broken clouds and thunder

Mon   Apr 22
29°C | 23°C
NE 14 km/h
2.1 mm
partly cloudy and  chance of rain

partly cloudy and chance of rain

The best time of year to visit Trou aux Biches in Mauritius

During the months of June, July, August, September and October you are most likely to experience good weather with pleasant average temperatures that fall between 20°C and 26°C.

Other facts from our historical weather data:

  • Which months have the greatest rainfall in Trou aux Biches?
    Most rainfall (rainy season) is seen in January and February.
  • Which is the warmest month in Trou aux Biches?
    February has an average maximum temperature of 29°C and is the warmest month of the year.
  • Which is the coldest month in Trou aux Biches?
    The coldest month is August with an average maximum temperature of 24°C.
  • Which is the wettest month in Trou aux Biches?
    February tops the wettest month list with 172 mm of rainfall.
  • Which is the driest month in Trou aux Biches?
    July is the driest month with 24 mm of precipitation.
  • Which is the sunniest month in Trou aux Biches?
    December is the sunniest month with an average of 283 hours of sunshine.

  • No idea where to travel to this year? We have a tool that recommends destinations based on your ideal conditions. Find out where to go with our weather planner.