ClimateForecastAprilMay >>

Climate in Rawang (Selangor), Malaysia

The graphs below show the monthly weather averages over the year.

Average day and night temperature

The mean minimum and maximum temperatures over the year.

Average monthly minimum and maximum temperature in Rawang, Malaysia

Feel free to add this climate graph to your website. Click the copy button above.

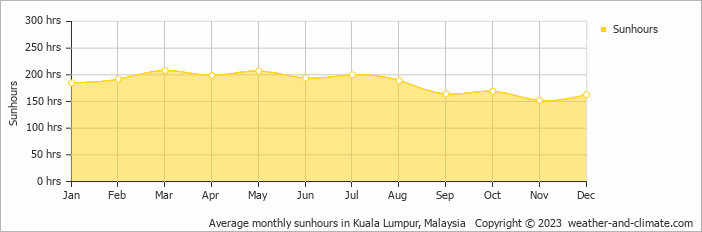
Monthly hours of sunshine

The average monthly total hours of sunshine over the year
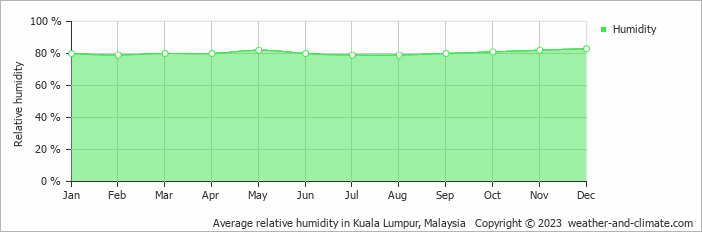
Average monthly hours of sunshine in Rawang, Malaysia

Feel free to add this climate graph to your website. Click the copy button above.

* Data from: Kuala Lumpur, Malaysia (23 KM, 14 Miles).

Monthly precipitation

The mean monthly precipitation over the year, including rain, snow, hail etc.

Average monthly rainfall, snow, precipitation in Rawang, Malaysia

Feel free to add this climate graph to your website. Click the copy button above.

Monthly rainy days

The average number of days each month with rain, snow, hail etc.

Average monthly rainy days in Rawang, Malaysia

Feel free to add this climate graph to your website. Click the copy button above.

Average humidity

The mean monthly relative humidity over the year

Average monthly relative humidity in Rawang, Malaysia

Feel free to add this climate graph to your website. Click the copy button above.

* Data from: Kuala Lumpur, Malaysia (23 KM, 14 Miles).

Average wind speed

The mean monthly wind speed over the year (in meters per second)

Average monthly wind speed in Rawang, Malaysia

Feel free to add this climate graph to your website. Click the copy button above.

* Data from: Kuala Lumpur, Malaysia (23 KM, 14 Miles).

Weather Forecasts for Rawang

Sat   Apr 20
32°C | 25°C
NW 7 km/h
9.4 mm
broken clouds and thunder

broken clouds and thunder

Sun   Apr 21
32°C | 25°C
NW 7 km/h
7.8 mm
broken clouds and thunder

broken clouds and thunder

Mon   Apr 22
34°C | 25°C
NW 7 km/h
4.2 mm
broken clouds and thunder

broken clouds and thunder

The best time of year to visit Rawang in Malaysia

Rawang has high temperatures year round ranging between 31°C and 32°C.
The average rainfall figures in Rawang are quite high. Throughout the year, you have a chance of prolonged precipitation. So no matter what time of year you go, you will always have to deal with a high number of rainy days. This makes it more challenging to point out the best time of year to visit. If we needed to pick one month we would choose March which is the sunniest month of the year.

Other facts from our historical weather data:

  • Which is the hottest month in Rawang?
    March has an average maximum temperature of 33°C and is the hottest month of the year.
  • Which is the coolest month in Rawang?
    The coolest month is January with an average maximum temperature of 31°C.
  • Which is the wettest month in Rawang?
    November tops the wettest month list with 373 mm of rainfall.
  • Which is the driest month in Rawang?
    July is the driest month with 140 mm of precipitation.
  • Which is the sunniest month in Rawang?
    March is the sunniest month with an average of 208 hours of sunshine.

  • No idea where to travel to this year? We have a tool that recommends destinations based on your ideal conditions. Find out where to go with our weather planner.