ClimateForecastAprilMay >>

Climate in Quetzaltenango (Quetzaltenango), Guatemala

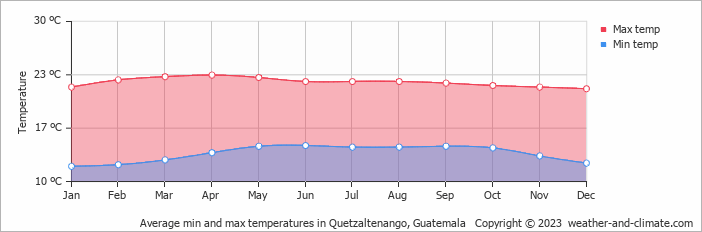
The graphs below show the monthly weather averages over the year.

Average day and night temperature

The mean minimum and maximum temperatures over the year.

Average monthly minimum and maximum temperature in Quetzaltenango, Guatemala

Feel free to add this climate graph to your website. Click the copy button above.

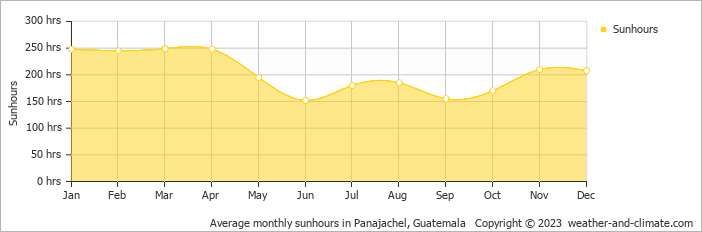
Monthly hours of sunshine

The average monthly total hours of sunshine over the year

Average monthly hours of sunshine in Quetzaltenango, Guatemala

Feel free to add this climate graph to your website. Click the copy button above.

* Data from: Panajachel, Guatemala (40 KM, 25 Miles).

Monthly precipitation

The mean monthly precipitation over the year, including rain, snow, hail etc.

Average monthly rainfall, snow, precipitation in Quetzaltenango, Guatemala

Feel free to add this climate graph to your website. Click the copy button above.

Monthly rainy days

The average number of days each month with rain, snow, hail etc.

Average monthly rainy days in Quetzaltenango, Guatemala

Feel free to add this climate graph to your website. Click the copy button above.

Average humidity

The mean monthly relative humidity over the year

Average monthly relative humidity in Quetzaltenango, Guatemala

Feel free to add this climate graph to your website. Click the copy button above.

* Data from: Panajachel, Guatemala (40 KM, 25 Miles).

Weather Forecasts for Quetzaltenango

Fri   Apr 19
25°C | 9°C
S 11 km/h
4.1 mm
broken clouds and  chance of rain

broken clouds and chance of rain

Sat   Apr 20
25°C | 9°C
S 11 km/h
7.3 mm
broken clouds and thunder

broken clouds and thunder

Sun   Apr 21
24°C | 8°C
NE 11 km/h
8.7 mm
broken clouds and thunder

broken clouds and thunder

The best time of year to visit Quetzaltenango in Guatemala

Other facts from our historical weather data:

  • Which is the warmest month in Quetzaltenango?
    April has an average maximum temperature of 23°C and is the warmest month of the year.
  • Which is the coldest month in Quetzaltenango?
    The coldest month is January with an average maximum temperature of 22°C.
  • Which is the wettest month in Quetzaltenango?
    May tops the wettest month list with 461 mm of rainfall.
  • Which is the driest month in Quetzaltenango?
    January is the driest month with 34 mm of precipitation.
  • Which is the sunniest month in Quetzaltenango?
    March is the sunniest month with an average of 249 hours of sunshine.

  • No idea where to travel to this year? We have a tool that recommends destinations based on your ideal conditions. Find out where to go with our weather planner.